怎么画这个图?
Posted on 02 Feb 2015 MatplotlibPython 添加评论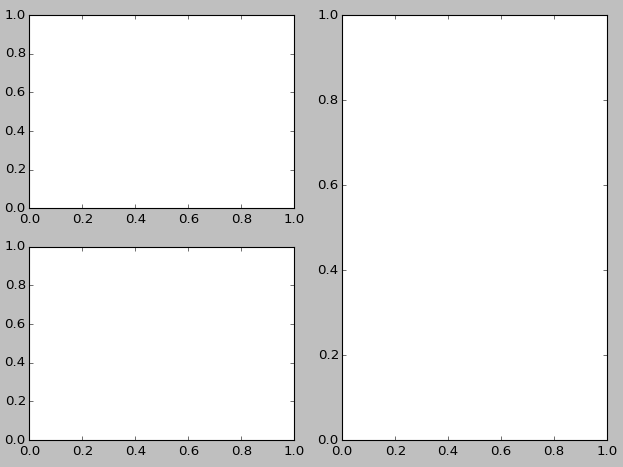 如果想画这个样子的坐标轴布局的图,Matplotlib怎么做?
Matlab里很简单啦!
subplot(221)
subplot(223)
subplot(2,2,[2,4])
我觉得这个设计很好很简洁,操控性也很好,但是同样的代码在Matplotlib却不能用,很不愉快。
那么Matplotlib怎么完成这样的工作呢?subplot有一个一致性不好的功能:先把图像理解成$2 \times 2$的,然后再把图像看作 $1 \times 2$的。
subplot(221)
subplot(223)
subplot(122)这个功能实际上Matlab也兼容,是一个比较奇怪的设计。不过还算可以理解。如果你在Matplotlib中真的需要各种各样的自定义坐标轴,那么你需要的可能不是subplot了,而是Maplotlib中真正用来做这个工作的工具:subplot2grid
Create a subplot in a grid.  The grid is specified by *shape*, at
location of *loc*, spanning *rowspan*, *colspan* cells in each
direction.  The index for loc is 0-based.
比如下面的布局可以这样实现:

subplot(333)
subplot(336)
subplot(339)
subplot2grid((3,3),(0,0),3,2)再不能满足的话,GridSpec和AxesGrid应该可以满足了。否则的话,Matplotlib现有的功能就超越了你的需要,你可能需要自己动手了。