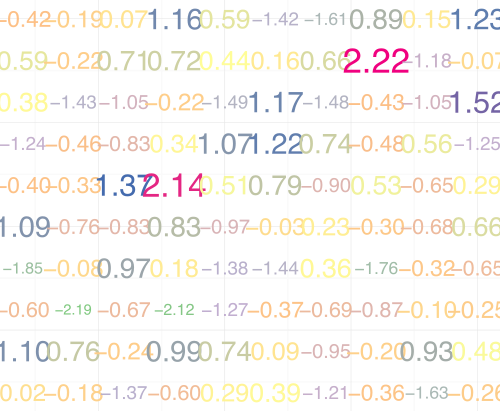
你知道这个图怎么画的吗?
Posted on 05 Dec 2014 ggplotRTutorial 添加评论 看着乱乱的,这种图是怎么画的呢?用Matlab,Python或者其他的软件应该都能画,大家可以试试喽!过几天公布我画这张图的方法。
下面是这张图的绘制方法,很简单吧!
library(reshape2)
library(ggplot2)
set.seed(10)
data <- rnorm(100)
dim(data) <- c(10,10)
md <- melt(data)
md$lb<-sprintf('%.2f',md$value)
p<-ggplot(md,aes(Var1,Var2,label=lb))+
  geom_text(aes(color=value,size=value))+
  scale_color_distiller(palette='Accent')+
  scale_size_continuous(range=c(4,9))+
  theme_minimal()+
  labs(x='',y='')
p